Difference between revisions of "Formula Specification in Templates"
(→Matrix) |
|||
| (32 intermediate revisions by 2 users not shown) | |||
| Line 1: | Line 1: | ||
The list of formula specifications used in Templates. (Notes: bold inputs for functions are linked to the data in program). | |||
=== Logical === | === Logical === | ||
| Line 39: | Line 37: | ||
''IF(220>200;220-200;200-220) ⇒ 20'' | ''IF(220>200;220-200;200-220) ⇒ 20'' | ||
''IF(120>MAX(''' | ''IF(120>MAX('''{X⇕}''');120;-1) ⇒ 120'' | ||
''IF(MAX(''' | ''IF(MAX('''{X⇓2:⇓3}''')>'''{X⇓7}''';MAX('''{X⇓2:⇓3}''');'''{X⇓7}''')) ⇒ 6'' | ||
''IF(MAX(''' | ''IF(MAX('''1;2''')>'''6''';MAX('''1;2''');'''6''') ⇒ 6'' | ||
Result is text: | Result is text: | ||
''Input'' ''''' | ''Input'' '''''{Coordinate Z}''''' ''= 210''';{GWT}''' = 180'' | ||
''IF(''' | ''IF('''{Coordinate Z}'''>0;"Above terrain";"Under terrain") ⇒ "Top above terrain"'' | ||
''IF(''' | ''IF('''{GWT}'''<'''{Coordinate Z}''';"GWT under top of the test.";"Measure error.") ⇒ "GWT under top of the test."'' | ||
|- | |- | ||
|IFS | |IFS | ||
|''IFS(Test1;Then1;Test2;Then2; ... ;Else)'' | |''IFS(Test1;Then1;Test2;Then2; ... ;Else)'' | ||
|Checks whether one or more conditions are met and returns a value that corresponds to the first TRUE condition | |Checks whether one or more conditions are met and returns a value that corresponds to the first TRUE condition | ||
|''Input'' ''''' | |''Input'' '''''{GWT}''''' ''= 15'' | ||
''IFS(''' | ''IFS('''{GWT}'''>8;10;'''{GWT}'''>6;9;'''{GWT}'''>3;8;-1) ⇒ 10'' | ||
|- | |- | ||
|NOT | |NOT | ||
| Line 123: | Line 121: | ||
''CEILING(-10.4;5;1) ⇒ -15'' | ''CEILING(-10.4;5;1) ⇒ -15'' | ||
CEILING(-10.4;2;0) | ''CEILING(-10.4;2;0) ⇒ -10'' | ||
CEILING(-10.4;2;1) | ''CEILING(-10.4;2;1) ⇒ -12'' | ||
|- | |- | ||
|COS | |COS | ||
| Line 221: | Line 219: | ||
|Returns the sum of a series of numbers | |Returns the sum of a series of numbers | ||
|''Inputs linked to data '''X[0;1;2;3;4;5;6]'''):'' | |''Inputs linked to data '''X[0;1;2;3;4;5;6]'''):'' | ||
''SUM(''' | ''SUM('''{X⇓2:⇓5}''') ... SUM('''1; 2; 3; 4''') ⇒ 10'' | ||
''SUM(''' | ''SUM('''{X⇕}''') ⇒ 21'' | ||
|- | |||
|SUMIF | |||
| | |||
|Returns the sum of all the values that meet a given criteria | |||
|''SUMIF('''{X_Coor⇕}''';">2";'''{Y_Coor⇕}''')'' | |||
|- | |||
|SUMIFS | |||
| | |||
|Returns the sum of all the values that meet the given criterias | |||
| | |||
|- | |- | ||
|DEG | |DEG | ||
| Line 230: | Line 238: | ||
|''DEGREES(PI()) ⇒ 180°; DEGREES(PI()/2) ⇒ 90°'' | |''DEGREES(PI()) ⇒ 180°; DEGREES(PI()/2) ⇒ 90°'' | ||
|- | |- | ||
| | |RADIANS | ||
|''RADIANS(Number)'' | |''RADIANS(Number)'' | ||
|Converts degrees to radians | |Converts degrees to radians | ||
| Line 290: | Line 298: | ||
''CONCAT(12;"34";56) ⇒ 123456.000'' | ''CONCAT(12;"34";56) ⇒ 123456.000'' | ||
''Input ''' | ''Input '''{GWT<sub>b</sub>}''' = 15'' | ||
''CONCAT( | ''CONCAT('''{GWT<sub>b</sub>}''';" m") ⇒ "15 m"'' | ||
|- | |- | ||
|LEFT | |LEFT | ||
| Line 299: | Line 307: | ||
|''LEFT("qwert";3) ⇒ "qwe"'' | |''LEFT("qwert";3) ⇒ "qwe"'' | ||
''LEFT("qwert";1) ⇒ "q"'' | ''LEFT("qwert";1) ⇒ "q"'' | ||
|- | |||
|LEN | |||
|''LEN(Text)'' | |||
|Returns the number of characters in a text string | |||
|''LEN("qwert") ⇒ 5'' | |||
''LEN("") ⇒ 0'' | |||
|- | |- | ||
|RIGHT | |RIGHT | ||
| Line 305: | Line 319: | ||
|''RIGHT("qwert";3) ⇒ "ert"'' | |''RIGHT("qwert";3) ⇒ "ert"'' | ||
''RIGHT("qwert";1) ⇒ "t"'' | ''RIGHT("qwert";1) ⇒ "t"'' | ||
|- | |- | ||
|SEARCH | |SEARCH | ||
| Line 316: | Line 324: | ||
|Finds one text value within another (not case-sensitive) | |Finds one text value within another (not case-sensitive) | ||
|''SEARCH("G";"Hello GEO!";1) ⇒ 7'' | |''SEARCH("G";"Hello GEO!";1) ⇒ 7'' | ||
|- | |||
|TEXT | |||
| | |||
|Converts number to text | |||
| | |||
|} | |} | ||
=== Statistical === | === Statistical === | ||
| Line 329: | Line 342: | ||
|''AVERAGE(3;5;1) ⇒ 3'' | |''AVERAGE(3;5;1) ⇒ 3'' | ||
''Inputs linked to data '''X[0;1;2;3;4;5;6]'''):'' | ''Inputs linked to data '''X[0;1;2;3;4;5;6]'''):'' | ||
''AVERAGE(''' | ''AVERAGE('''{X⇓3:⇓5}''') ... AVERAGE('''2; 3; 4''') ⇒ 3'' | ||
|- | |||
|AVERAGEIF | |||
| | |||
|Returns the average (arithmetic mean) of all the values that meet a given criteria | |||
| | |||
|- | |||
|AVERAGEIFS | |||
| | |||
|Returns the average (arithmetic mean) of all the values that meet the given criterias | |||
| | |||
|- | |- | ||
|MAX | |MAX | ||
| Line 337: | Line 360: | ||
''Inputs linked to data '''X[0;1;2;3;4;5;6]'''):'' | ''Inputs linked to data '''X[0;1;2;3;4;5;6]'''):'' | ||
''MAX(''' | ''MAX('''{X⇓3:⇓5}''') ... AVERAGE('''2; 3; 4''') ⇒ 3'' | ||
|- | |- | ||
|MIN | |MIN | ||
| Line 345: | Line 368: | ||
''Inputs linked to data '''X[0;1;2;3;4;5;6]'''):'' | ''Inputs linked to data '''X[0;1;2;3;4;5;6]'''):'' | ||
''MIN(''' | ''MIN('''{X⇓3:⇓5}''') ... AVERAGE('''2; 3; 4''') ⇒ 2'' | ||
|- | |- | ||
|PERCENTIL | |PERCENTIL | ||
| Line 351: | Line 374: | ||
|Returns the k-th percentile of values in a range | |Returns the k-th percentile of values in a range | ||
|''Inputs linked to data '''X[1;2;3;4;5]'''):'' | |''Inputs linked to data '''X[1;2;3;4;5]'''):'' | ||
''PERCENTILE( | ''PERCENTILE('''{X⇕}''';0.5) ⇒ 3'' | ||
|- | |- | ||
|PERCENTILE.EXC | |PERCENTILE.EXC | ||
| Line 357: | Line 380: | ||
|Returns the k-th percentile of values in a range, where k is in the range 0..1, exclusive | |Returns the k-th percentile of values in a range, where k is in the range 0..1, exclusive | ||
|''Inputs linked to data '''X[1;2;3;4;5]'''):'' | |''Inputs linked to data '''X[1;2;3;4;5]'''):'' | ||
''PERCENTILE.INC( | ''PERCENTILE.INC('''{X⇕}''';1) ⇒ NAN'' | ||
''PERCENTILE.INC( | ''PERCENTILE.INC('''{X⇕}''';0.4) ⇒ 2.4'' | ||
|- | |- | ||
|PERCENTILE.INC | |PERCENTILE.INC | ||
| Line 365: | Line 388: | ||
|Returns the k-th percentile of values in a range | |Returns the k-th percentile of values in a range | ||
|''Inputs linked to data '''X[1;2;3;4;5]'''):'' | |''Inputs linked to data '''X[1;2;3;4;5]'''):'' | ||
''PERCENTILE.INC( | ''PERCENTILE.INC('''{X⇕}''';1) ⇒ 5'' | ||
|- | |- | ||
|STDEV | |STDEV | ||
| Line 371: | Line 394: | ||
|Estimates standard deviation based on a sample | |Estimates standard deviation based on a sample | ||
|''Inputs linked to data '''X[1;2;3;4;5]'''):'' | |''Inputs linked to data '''X[1;2;3;4;5]'''):'' | ||
''STDEV( | ''STDEV('''{X⇕}''') ⇒ 1.581'' | ||
|- | |- | ||
|STDEV.P | |STDEV.P | ||
| Line 377: | Line 400: | ||
|Calculates standard deviation based on the entire population | |Calculates standard deviation based on the entire population | ||
|''Inputs linked to data '''X[1;2;3;4;5]'''):'' | |''Inputs linked to data '''X[1;2;3;4;5]'''):'' | ||
''STDEV.P( | ''STDEV.P('''{X⇕}''') ⇒ 1.414'' | ||
|- | |- | ||
|STDEV.S | |STDEV.S | ||
| Line 383: | Line 406: | ||
|Estimates standard deviation based on a sample | |Estimates standard deviation based on a sample | ||
|''Inputs linked to data '''X[1;2;3;4;5]'''):'' | |''Inputs linked to data '''X[1;2;3;4;5]'''):'' | ||
''STDEV.S( | ''STDEV.S('''{X⇕}''') ⇒ 1.581'' | ||
|- | |||
|TRIMMEAN | |||
| | |||
|Returns the mean of the interior of a data set | |||
| | |||
|- | |- | ||
|MODE | |MODE | ||
| Line 389: | Line 417: | ||
|Returns the most common value in a data set | |Returns the most common value in a data set | ||
|''Inputs linked to data '''X[1;2;3;4;5]'''):'' | |''Inputs linked to data '''X[1;2;3;4;5]'''):'' | ||
''MODE(( | ''MODE(('''{X⇕}''') ⇒ NAN'' | ||
''MODE(( | ''MODE(('''{X⇕}''';3) ⇒ 3'' | ||
|- | |- | ||
|MEDIAN | |MEDIAN | ||
| Line 411: | Line 439: | ||
|Uses an index to choose a value from a reference or array | |Uses an index to choose a value from a reference or array | ||
|''Inputs linked to data '''Y[15;16;11;27;22]'''):'' | |''Inputs linked to data '''Y[15;16;11;27;22]'''):'' | ||
''INDEX(''' | ''INDEX('''{Y⇓}''';2) ⇒ 16'' | ||
''INDEX(''' | ''INDEX('''{Y⇓}''';4) ⇒ 27'' | ||
''INDEX(''' | ''INDEX('''{Y⇓}''';9) ⇒ NAN'' | ||
| | | | ||
|- | |- | ||
| Line 440: | Line 468: | ||
|''Inputs linked to data '''Y[15;16;11;27;22]'''):'' | |''Inputs linked to data '''Y[15;16;11;27;22]'''):'' | ||
MATCH(11; | ''MATCH(11;'''{Y⇕}''') ⇒ 3'' | ||
MATCH(27; | ''MATCH(27;'''{Y⇕}''') ⇒ 4'' | ||
MATCH(999; | ''MATCH(999;'''{Y⇕}''') ⇒ NAN'' | ||
| | | | ||
|} | |} | ||
| Line 454: | Line 482: | ||
!''Example'' | !''Example'' | ||
! | ! | ||
|- | |||
|FILTERTABLE | |||
|''FILTERTABLE(Coordinates X;Coordinates Y)'' | |||
|Filters repeating values and keeps the last one of them | |||
Returns matrix with 2 columns: | |||
Column 1: X - Filtered X | |||
Column 2: Y - Filtered Y | |||
|''Inputs linked to data'' | |||
''FILTERTABLE('''{X-value⇕}''';'''{Y-value⇕}''')'' | |||
(<s>2.000</s> ... ignored value, '''2.000''' ... saved value) | |||
{| class="wikitable" | |||
|+ | |||
| | |||
{| class="wikitable" | |||
!''Row'' | |||
!''Col. 1'' | |||
!''Col. 2'' | |||
|- | |||
|'''''1''''' | |||
|'''0.000''' | |||
|'''17.000''' | |||
|- | |||
|<s>2</s> | |||
|<s>2.000</s> | |||
|<s>25.000</s> | |||
|- | |||
|<s>3</s> | |||
|<s>2.000</s> | |||
|<s>25.000</s> | |||
|- | |||
|'''4''' | |||
|'''2.000''' | |||
|'''25.000''' | |||
|- | |||
|<s>5</s> | |||
|<s>4.000</s> | |||
|<s>32.000</s> | |||
|- | |||
|'''6''' | |||
|'''4.000''' | |||
|'''32.000''' | |||
|- | |||
|<s>7</s> | |||
|<s>6.000</s> | |||
|<s>24.000</s> | |||
|- | |||
|'''8''' | |||
|'''6.000''' | |||
|'''24.000''' | |||
|} | |||
|⇒⇒⇒⇒ | |||
| | |||
{| class="wikitable" | |||
!''Row'' | |||
!''Col. 1'' | |||
!''Col. 2'' | |||
|- | |||
|''1'' | |||
|0.000 | |||
|17.000 | |||
|- | |||
|2 | |||
|2.000 | |||
|25.000 | |||
|- | |||
|3 | |||
|4.000 | |||
|32.000 | |||
|- | |||
|4 | |||
|6.000 | |||
|24.000 | |||
|} | |||
|} | |||
|[[File:Filtertable function.png|center|thumb|360x360px|Filtertable function]] | |||
|- | |- | ||
|LINEARTREND | |LINEARTREND | ||
| Line 471: | Line 577: | ||
'''''X[1;2;3;4;5]; Y[15;16;11;27;22]''''' | '''''X[1;2;3;4;5]; Y[15;16;11;27;22]''''' | ||
''LINEARTREND( | ''LINEARTREND('''{X⇕}''';'''{Y⇕}''')'' | ||
''NumRows = 1'' | ''NumRows = 1'' | ||
| Line 513: | Line 619: | ||
'''''X[1;2;3;4;5]; Y[15;16;11;27;22]''''' | '''''X[1;2;3;4;5]; Y[15;16;11;27;22]''''' | ||
''LINEARTREND( | ''LINEARTREND('''{X⇕}''';'''{Y⇕}''')'' | ||
''NumRows = 2;'' | ''NumRows = 2;'' | ||
| Line 554: | Line 660: | ||
'''''X[4;8;15]; R[3;5;8]''''' | '''''X[4;8;15]; R[3;5;8]''''' | ||
''LINEARTRENDSC( | ''LINEARTRENDSC('''{X⇕}''';'''{R⇕}''')'' | ||
''NumRows = 1'' | ''NumRows = 1'' | ||
| Line 594: | Line 700: | ||
'''''X[4;8;15]; R[3;5;8]''''' | '''''X[4;8;15]; R[3;5;8]''''' | ||
''LINEARTRENDSCANDPOINTS( | ''LINEARTRENDSCANDPOINTS('''{X⇕}''';'''{R⇕}''')'' | ||
''NumRows = 2'' | ''NumRows = 2'' | ||
| Line 684: | Line 790: | ||
{| class="wikitable" | {| class="wikitable" | ||
!''Row'' | !''Row'' | ||
!''X'' | !''Col. 1'' | ||
!''Y'' | ''X'' | ||
!''Col. 2'' | |||
''Y'' | |||
|- | |- | ||
|''1.'' | |''1.'' | ||
| Line 734: | Line 842: | ||
Returns matrix with 1 columns: | Returns matrix with 1 columns: | ||
Column 1: c - Coefficients c<sub>0</sub> + c<sub>1</sub>*x + c<sub>2</sub>*x<sup>2</sup> + ... | Column 1 coefficients: | ||
| rowspan="2" |''POLYNOMIALTRENDANDPOINTS( | |||
c - Coefficients c<sub>0</sub> + c<sub>1</sub>*x + c<sub>2</sub>*x<sup>2</sup> + ... | |||
| rowspan="2" |''POLYNOMIALTRENDANDPOINTS('''{X-Input⇕}''';'''{Y-Input⇕}''';2;9)'' | |||
''Order = 2'' | ''Order = 2'' | ||
| Line 741: | Line 851: | ||
''Points count = 9'' | ''Points count = 9'' | ||
''Coeff.: c<sub>0</sub> = 8,238; c<sub>1</sub> = 13.203; c<sub>2</sub> = -1.32'' | |||
''Approx. formula: y = -1,32x<sup>2</sup> + 13,203x + 8,238'' | ''Approx. formula: y = -1,32x<sup>2</sup> + 13,203x + 8,238'' | ||
Results: | |||
{| class="wikitable" | {| class="wikitable" | ||
!''Row'' | !''Row'' | ||
!c | !''Col. 1'' | ||
!''X'' | ''c'' | ||
!''Y'' | !''Col. 2'' | ||
''X'' | |||
!''Col. 3'' | |||
''Y'' | |||
|- | |- | ||
|''1.'' | |''1.'' | ||
|8.238 | |''8.238'' | ||
| 1 | | ''1'' | ||
|20.121 | |''20.121'' | ||
|- | |- | ||
|''2.'' | |''2.'' | ||
|13.203 | |''13.203'' | ||
| ''2'' | | ''2'' | ||
|29.364 | |''29.364'' | ||
|- | |- | ||
|''3.'' | |''3.'' | ||
| -1.32 | | ''-1.32'' | ||
| 3 | | ''3'' | ||
|35.965 | |''35.965'' | ||
|- | |- | ||
|''4.'' | |''4.'' | ||
| | | | ||
| 4 | | ''4'' | ||
|39.926 | |''39.926'' | ||
|- | |- | ||
|''5.'' | |''5.'' | ||
| | | | ||
| 5 | | ''5'' | ||
|41.247 | |''41.247'' | ||
|- | |- | ||
|''6.'' | |''6.'' | ||
| | | | ||
|''6'' | |''6'' | ||
|39.926 | |''39.926'' | ||
|- | |- | ||
|''7.'' | |''7.'' | ||
| | | | ||
|7 | |''7'' | ||
|35.965 | |''35.965'' | ||
|- | |- | ||
|''8.'' | |''8.'' | ||
| | | | ||
|8 | |''8'' | ||
|29.364 | |''29.364'' | ||
|- | |- | ||
|''9.'' | |''9.'' | ||
| | | | ||
|9 | |''9'' | ||
|20.121 | |''20.121'' | ||
|} | |} | ||
| rowspan="2" |[[File:Results of PolynomialPoints approximation.png|center|thumb|Results of PolynomialPoints approximation]] | | rowspan="2" |[[File:Results of PolynomialPoints approximation.png|center|thumb|Results of PolynomialPoints approximation|350x350px]] | ||
|- | |- | ||
|POLYNOMIALTRENDANDPOINTS | |POLYNOMIALTRENDANDPOINTS | ||
| Line 802: | Line 917: | ||
Returns matrix with 3 columns: | Returns matrix with 3 columns: | ||
Column 1: c - Coefficients c<sub>0</sub> + c<sub>1</sub>*x + c<sub>2</sub>*x<sup>2</sup> + ... | Column 1 coefficients: | ||
c - Coefficients c<sub>0</sub> + c<sub>1</sub>*x + c<sub>2</sub>*x<sup>2</sup> + ... | |||
Column 2: X - Coordinates X | Column 2: X - Coordinates X | ||
Column 3: Y - Coordinates Y | Column 3: Y - Coordinates Y | ||
Force origin: True ... if you want include point (0,0) in Coordinates X and Y | |||
|- | |- | ||
|SPLINE | |SPLINE | ||
|SPLINE(Coordinates X;Coordinates Y;[Points count=20]) | |SPLINE(Coordinates X;Coordinates Y;[Points count=20]) | ||
|Returns points of the spline | |Returns points of the spline running through given points | ||
Returns matrix with 2 columns: | Returns matrix with 2 columns: | ||
| Line 816: | Line 935: | ||
Column 2: Y - Coordinates Y | Column 2: Y - Coordinates Y | ||
Coordinates X and Y are part of the Spline curve | |||
Inputs: | |||
{| class="wikitable" | |||
!''Row'' | |||
!''X'' | |||
!''Y'' | |||
|- | |||
|''1.'' | |||
| ''5'' | |||
|''5'' | |||
|- | |||
|''2.'' | |||
| ''10'' | |||
|''7'' | |||
|- | |||
|''3.'' | |||
| ''15'' | |||
|''3'' | |||
|- | |||
|''4.'' | |||
|''20'' | |||
|''6'' | |||
|} | |||
|''SPLINE('''{X-Input⇕}''';'''{Y-Input⇕}''';[Num of Points])'' | |||
''Num of Points = 8'' | |||
''Results:'' | |||
{| class="wikitable" | |||
!''Row'' | |||
!''Col. 1'' | |||
''X'' | |||
!''Col. 2'' | |||
''Y'' | |||
|- | |||
|''1.'' | |||
|''5,000'' | |||
|''5,000'' | |||
|- | |||
|''2.'' | |||
|''5,465'' | |||
|''5,313'' | |||
|- | |||
|''3.'' | |||
|''6,016'' | |||
|''5,668'' | |||
|- | |||
|''4.'' | |||
|''6,633'' | |||
|''6,035'' | |||
|- | |||
|''5.'' | |||
|''7,296'' | |||
|''6,385'' | |||
|- | |||
|''6.'' | |||
|''...'' | |||
|''...'' | |||
|} | |||
|[[File:Result of Spline function.png|center|thumb|Result of Spline function|350x350px]] | |||
|} | |||
=== Informative === | |||
{| class="wikitable sortable mw-collapsible" | |||
!Name | |||
!Syntax, parameters | |||
!Description | |||
!''Example'' | |||
! | |||
|- | |||
|ISIMPERIAL | |||
|''ISIMPERIAL()'' | |||
|Returns TRUE if project is calculated in imperial units | |||
|''If the project is in imperial [ft, in, ...] units:'' | |||
''ISIMPERIAL() ⇒ TRUE; ⇒ 1'' | |||
''ISMETRIC() ⇒ FALSE; ⇒ 0'' | |||
| | |||
|- | |||
|ISMETRIC | |||
|''ISMETRIC()'' | |||
|Returns TRUE if project is calculated in metric units | |||
|''If the project is in metric [m, mm, ...] units:'' | |||
''ISMETRIC() ⇒ TRUE; ⇒ 1'' | |||
''ISIMPERIAL() ⇒ FALSE; ⇒ 0'' | |||
| | |||
|- | |||
|ISNUMBER | |||
|''ISNUMBER()'' | |||
|Returns TRUE if argument is number | |||
|ISNUMBER(15) ''⇒ TRUE; ⇒ 1'' | |||
ISNUMBER(15e2) ''⇒ TRUE; ⇒ 1'' | |||
ISNUMBER(1/4) ''⇒ TRUE; ⇒ 1'' | |||
ISNUMBER(aaa) ''⇒ FALSE; ⇒ 0'' | |||
| | |||
|- | |||
|ISTEXT | |||
|''ISTEXT()'' | |||
|Returns TRUE if argument is text | |||
|ISTEXT(123) | |||
ISTEXT("123") | |||
ISTEXT(abc) | |||
ISTEXT("abc") | |||
| | |||
|- | |||
|LANG | |||
|''LANG()'' | |||
|LANG([ Application = False ]) | |||
|''If the application is in English and output language is Spanish:'' | |||
''LANG(FALSE()) ⇒ EN; LANG(0) ⇒ EN'' | |||
''LANG(TRUE()) ⇒ ES; LANG(1) ⇒ ES'' | |||
| | |||
|} | |||
=== Geotechnic === | |||
{| class="wikitable sortable mw-collapsible" | |||
!Name | |||
!Syntax, parameters | |||
!Description | |||
!''Example'' | |||
! | |||
|- | |||
|FINESOILCLASSIFICATION | |||
|''FINESOILCLASSIFICATION(Plasticity Index [-];Moisture [-];'' | |||
''Method 0 = EN ISO 14688-2 (2018); 1 = EN ISO 14688-2 (2013);'' | |||
''2 = ČSN 73 6133)'' | |||
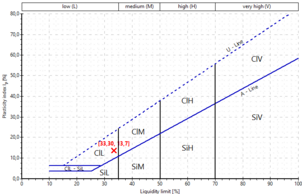
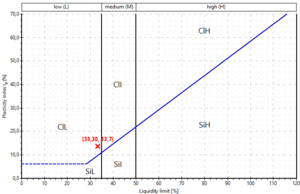
For classification we can use these standards for plasticity diagram:[[File:Standards for plasticity diagram.png|thumb|Possible standards for plasticity diagram]] | |||
|Returns the classification of fine soil according to selected method | |||
For inputs use number from interval (0;1) | |||
''FINESOILCLASSIFICATION(0.137;0.333;0) ⇒ ClL'' | |||
or percetage | |||
''FINESOILCLASSIFICATION(13.7/100;33.3/100;0) ⇒ ClL'' | |||
or inputs linked to data according to unit | |||
''FINESOILCLASSIFICATION({I\_p\-⇓ [-]}/100;{LiqLimit⇓ [-]}/100;0)'' | |||
or inputs linked to data with unit setup | |||
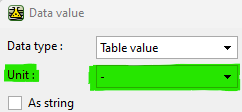
''FINESOILCLASSIFICATION({I\_p\-⇓ [-]};{LiqLimit⇓ [-]};0)''[[File:Unit setup for input.png|thumb|Unit setup for input]] | |||
|''FINESOILCLASSIFICATION(0.137;0.333;0) ⇒ ClL''[[File:Fine Soil Classification ISO 14-688-2 (2018).png|thumb|Fine Soil Classification EN ISO 14-688-2 (2018)|center|302x302px]]''FINESOILCLASSIFICATION(0.137;0.333;1) ⇒ ClL''[[File:Fine Soil Classification EN ISO 14-688-2 (2013).png|center|thumb|Fine Soil Classification EN ISO 14-688-2 (2013)]] | |||
|- | |||
|SOILCLASSIFICATION | |||
|''SOILCLASSIFICATION(Size [mm];Fall [-];Method 0 = EN ISO 14688-2 (2018))'' | |||
|Returns the classification of soil according to selected method | |||
| | | | ||
{| class="wikitable" | |||
|Číslo | |||
|Průměr zrn | |||
|Propad | |||
|- | |||
| | | | ||
|[mm] | |||
|[%] | |||
|- | |||
|1 | |||
|32,000 | |||
|100,00 | |||
|- | |||
|2 | |||
|16,000 | |||
|100,00 | |||
|- | |||
|3 | |||
|8,000 | |||
|100,00 | |||
|- | |||
|4 | |||
|4,000 | |||
|99,76 | |||
|- | |||
|5 | |||
|2,000 | |||
|98,76 | |||
|- | |||
|6 | |||
|1,000 | |||
|97,52 | |||
|- | |||
|7 | |||
|0,500 | |||
|95,52 | |||
|- | |||
|8 | |||
|0,200 | |||
|91,52 | |||
|- | |||
|9 | |||
|0,100 | |||
|85,02 | |||
|- | |||
|10 | |||
|0,063 | |||
|79,02 | |||
|- | |||
|11 | |||
|0,057 | |||
|76,40 | |||
|- | |||
|12 | |||
|0,042 | |||
|70,70 | |||
|- | |||
|13 | |||
|0,030 | |||
|67,50 | |||
|- | |||
|14 | |||
|0,019 | |||
|65,00 | |||
|- | |||
|15 | |||
|0,011 | |||
|60,50 | |||
|- | |||
|16 | |||
|0,008 | |||
|57,40 | |||
|- | |||
|17 | |||
|0,006 | |||
|55,00 | |||
|- | |||
|18 | |||
|0,003 | |||
|51,20 | |||
|- | |||
|19 | |||
|0,001 | |||
|46,10 | |||
|} | |||
|} | |||
=== Date and Time === | |||
{| class="wikitable sortable mw-collapsible" | |||
!Name | |||
!Syntax, parameters | |||
!Description | |||
!''Example'' | |||
|- | |||
|DATE | |||
|''DATE(Year;Month;Day)'' | |||
|Returns the serial number of a particular date | |||
|''DATE(1899;12;30) ⇒ 0'' | |||
''DATE(2024;10;31) ⇒ 45596'' | |||
''Inputs linked to data'' | |||
'''''{MyYear}'''=2024;'''{MyMonth}'''=10;'''{MyDay}'''=31'' | |||
''DATE('''{MyYear}''';'''{MyMonth}''';'''{MyDay}''') ⇒ 45596'' | |||
|- | |||
|NOW | |||
|''NOW()'' | |||
|Returns the serial number of the current date and time | |||
|''For date and time 20.12.2024 13:48:04 is'' | |||
''NOW() ⇒ 45646.5750510648'' | |||
''For date and time 01.01.1900 00:00:00 is'' | |||
''NOW() ⇒ 1.00'' | |||
|- | |||
|TIME | |||
|''TIME(Hour;Minute;Second)'' | |||
|Returns the serial number of a particular time | |||
|''TIME(0;0;0) ⇒ 0'' | |||
''TIME(18;15;20) ⇒ 0.760648'' | |||
''Inputs linked to data'' | |||
'''''{MyHour}'''=10[hour];'''{MyMinute}'''=15[min.];'''{MySecond}'''=25[sec.]'' | |||
''TIME('''{MyHour}''';'''{MyMinute}''';'''{MySecond}''') ⇒ 0.42737'' | |||
|- | |||
|TODAY | |||
|''TODAY()'' | |||
|Returns the serial number of the current date | |||
|''For date 20:12:2024'' | |||
''TODAY() ⇒ 45646'' | |||
''For date 1.1.1900'' | |||
''TODAY() ⇒ 1'' | |||
|} | |} | ||
Latest revision as of 15:30, 20 December 2024
The list of formula specifications used in Templates. (Notes: bold inputs for functions are linked to the data in program).
Logical
| Name | Syntax, parameters | Description | Example |
|---|---|---|---|
| AND | AND(Boolean1;Boolean2; ... ) | Returns TRUE if all of its arguments are TRUE | AND(3=3;2=2) ⇒ TRUE |
| OR | OR(Boolean1;Boolean2; ... ) | Returns TRUE if any of its arguments are TRUE | OR(3=4;2=3) ⇒ FALSE |
| TRUE | TRUE() | Returns the logical value TRUE | IF(TRUE();1;2) ⇒ 1 |
| FALSE | FALSE() | Returns the logical value FALSE | IF(FALSE();1;2) ⇒ 2 |
| IF | IF(Test;Then;Else) | Specifies a logical test to perform
- inputs can be linked to data - result can be number, text, logical value |
Result is number (bold inputs linked to data X[0;1;2;3;4;5;6]):
IF(220>200;220-200;200-220) ⇒ 20 IF(120>MAX({X⇕});120;-1) ⇒ 120 IF(MAX({X⇓2:⇓3})>{X⇓7};MAX({X⇓2:⇓3});{X⇓7})) ⇒ 6 IF(MAX(1;2)>6;MAX(1;2);6) ⇒ 6 Result is text: Input {Coordinate Z} = 210;{GWT} = 180 IF({Coordinate Z}>0;"Above terrain";"Under terrain") ⇒ "Top above terrain" IF({GWT}<{Coordinate Z};"GWT under top of the test.";"Measure error.") ⇒ "GWT under top of the test." |
| IFS | IFS(Test1;Then1;Test2;Then2; ... ;Else) | Checks whether one or more conditions are met and returns a value that corresponds to the first TRUE condition | Input {GWT} = 15
IFS({GWT}>8;10;{GWT}>6;9;{GWT}>3;8;-1) ⇒ 10 |
| NOT | NOT(Boolean) | Reverses the logic of its argument | IF(NOT(5>6);175;155) ⇒ 175
IF(NOT(5>4);175;155) ⇒ 155 IF(NOT("A"="B");175;155)⇒ 175 |
| SWITCH | SWITCH(Switch;Case1;Result1;Case2;Result2; ... ;[ Else ]) | Evaluates an expression against a list of values and returns the result corresponding to the first matching value. If there is no match, an optional default value may be returned | SWITCH(50>6;TRUE();44;FALSE();56;-111) ⇒ 44
SWITCH(30/6;3;120;4;220;5;320;420) ⇒ 320 |
Mathematical
| Name | Syntax, parameters | Description | Example |
|---|---|---|---|
| ABS | ABS(Number) | Returns the absolute value of a number | ABS(120) ⇒ 120; ABS(-120) ⇒ 120 |
| ACOS | ACOS(Number) | Returns the arccosine of a number ⟨-Pi/2; Pi/2⟩ | for Number=0.5 ... DEGREES(ACOS(0.5)) ⇒ 60° |
| ACOT | ACOT(Number) | Returns the arccotangent of a number ⟨0; Pi⟩ | for Number=1 ... DEGREES(ACOT(1)) ⇒ 45° |
| ASIN | ASIN(Number) | Returns the arcsine of a number ⟨-Pi/2; Pi/2⟩ | for Number=0.5 ... DEGREES(ASIN(0.5)) ⇒ 30° |
| ATAN | ATAN(Number) | Returns the arctangent of a number ⟨-Pi/2; Pi/2⟩ | for Number=1 ... DEGREES(ATAN(1)) ⇒ 45° |
| CEILING | CEILING(Number;[Multiple=1];[Mode=0]) | Rounds a number to the nearest integer or to the nearest multiple of significance
- if Number<0 and Mode<>0 ⇒ result is rounded up - if Number<0 and Mode=0 ⇒ result is rounded down |
CEILING(10.4) ⇒ 11
CEILING(10.4;1) ⇒ 11 CEILING(10.4;5) ⇒ 15 CEILING(10.8;5) ⇒ 15 CEILING(-10.4;5;0) ⇒ -10 CEILING(-10.4;5;1) ⇒ -15 CEILING(-10.4;2;0) ⇒ -10 CEILING(-10.4;2;1) ⇒ -12 |
| COS | COS(Angle[rad]) | Returns the cosine of the given angle in rad | for α=60° ... COS(RADIANS(60)) ⇒ 0.5 |
| SIN | SIN(Angle[rad]) | Returns the sine of the given angle in rad | for α=30° ... SIN(RADIANS(30)) ⇒ 0.5 |
| COT | COT(Angle[rad]) | Returns the cotangent of an angle in rad | for α=45° ... COT(RADIANS(45)) ⇒ 1 |
| TAN | TAN(Angle[rad]) | Returns the tangent of an angle in rad | for α=45° ... TAN(RADIANS(45)) ⇒ 1 |
| EXP | EXP(Number) | Returns e raised to the power of a given number | EXP(1) ⇒ 2.71828 |
| FLOOR | FLOOR(Number;[Multiple=1];[Mode=0]) | Rounds a number down, to the nearest integer multiple of significance
- if Number<0 and Mode<>0 ⇒ result is rounded to zero - if Number<0 and Mode=0 ⇒ result is rounded away from zero |
FLOOR(10.4;1;0) ⇒ 10
FLOOR(10.9;1;0) ⇒ 10 FLOOR(10.4;7;0) ⇒ 7 FLOOR(-10.4;1;0) ⇒ -11 FLOOR(-10.4;1;1) ⇒ -10 FLOOR(-10.4;7;0) ⇒ -14 FLOOR(-10.4;7;1) ⇒ -7 |
| LN | LN(Number) | Returns the natural logarithm of a number | LN(1)) ⇒ 0; LN(EXP(1)) ⇒ 1 |
| LOG | LOG(Number;[Base=10]) | Returns the logarithm of a number to a specified base (10 if missing) | LOG(1; 10) ⇒ 0; LOG(10; 10) ⇒ 1 |
| LOG10 | LOG10(Number) | Returns the base-10 logarithm of a number | LOG10(1) ⇒ 0; LOG10(10) ⇒ 1 |
| MROUND | MROUND(Number;Multiple) | Returns a number rounded to the desired multiple
- rounds up, if the remainder after dividing the number by the multiple is ≥ to Multiple / 2. |
MROUND(10.4;1) ⇒ 10
MROUND(10.4;2) ⇒ 10 MROUND(10;3) ⇒ 9 (Remainder = 1 < 1.5 (Multiple/2) MROUND(11;3) ⇒ 12 (Remainder = 2 > 1.5 (Multiple/2) |
| PI | PI() | Returns the value of pi | PI() ⇒ 3.141592653 |
| POWER | POWER(Base;Number) | Returns the result of a number raised to a power | POWER(2;4) ⇒ 16 |
| SQR | SQR(Number) | Returns the result of a squared number | SQR(5) ⇒ 25; SQR(-5) ⇒ 25 |
| SQRT | SQRT(Number) | Returns a positive square root of a positive Number | SQRT(36) ⇒ 6; SQRT(-36) ⇒ NAN |
| SUM | SUM(Number1;Number2; ... ) | Returns the sum of a series of numbers | Inputs linked to data X[0;1;2;3;4;5;6]):
SUM({X⇓2:⇓5}) ... SUM(1; 2; 3; 4) ⇒ 10 SUM({X⇕}) ⇒ 21 |
| SUMIF | Returns the sum of all the values that meet a given criteria | SUMIF({X_Coor⇕};">2";{Y_Coor⇕}) | |
| SUMIFS | Returns the sum of all the values that meet the given criterias | ||
| DEG | DEGREES(Angle [rad]) | Converts radians into degrees | DEGREES(PI()) ⇒ 180°; DEGREES(PI()/2) ⇒ 90° |
| RADIANS | RADIANS(Number) | Converts degrees to radians | RADIANS(180) ⇒ π (3.141592653) |
| ROUND | ROUND(Number;Places) | Rounds a number to a specified number of digits
- negative Places round to the left of the decimal point |
ROUND(58.563;3) ⇒ 58.563
ROUND(58.563;2) ⇒ 58.56 ROUND(58.563;1) ⇒ 58.6 ROUND(58.563;0) ⇒ 59 ROUND(58.563;-1) ⇒ 60 ROUND(58.563;-2) ⇒ 100 |
| ROUNDUP | ROUNDUP(Number;Places) | Rounds a number up, toward zero | ROUNDUP(58.563;3) ⇒ 58.564
ROUNDUP(58.563;2) ⇒ 58.57 ROUNDUP(58.563;1) ⇒ 58.6 ROUNDUP(58.563;0) ⇒ 59 |
| ROUNDDOWN | ROUNDDOWN(Number;Places) | Rounds a number down, toward zero | ROUNDDOWN(58.563;3) ⇒ 58.563
ROUNDDOWN(58.563;2) ⇒ 58.56 ROUNDDOWN(58.563;1) ⇒ 58.5 ROUNDDOWN(58.563;0) ⇒ 58 ROUNDDOWN(58.563;-1) ⇒ 50 ROUNDDOWN(58.563;-2) ⇒ 0 |
Text
| Name | Syntax, parameters | Description | Example |
|---|---|---|---|
| CONCAT | CONCAT(Value1;Value2; ... ) | Combines the text from multiple ranges and/or strings, but it doesn't provide the delimiter or IgnoreEmpty arguments
- Value1, Value2, ... can be as Text or Number |
CONCAT(12;34;56) ⇒ 123456.000
CONCAT("12";"34";"56") ⇒ 123456.000 CONCAT(12;"34";56) ⇒ 123456.000 Input {GWTb} = 15 CONCAT({GWTb};" m") ⇒ "15 m" |
| LEFT | LEFT(Text;[Count=1]) | Returns the leftmost characters from a text value | LEFT("qwert";3) ⇒ "qwe"
LEFT("qwert";1) ⇒ "q" |
| LEN | LEN(Text) | Returns the number of characters in a text string | LEN("qwert") ⇒ 5
LEN("") ⇒ 0 |
| RIGHT | RIGHT(Text;[Count=1]) | Returns the rightmost characters from a text value | RIGHT("qwert";3) ⇒ "ert"
RIGHT("qwert";1) ⇒ "t" |
| SEARCH | SEARCH(Find text;Within text;[Start=1]) | Finds one text value within another (not case-sensitive) | SEARCH("G";"Hello GEO!";1) ⇒ 7 |
| TEXT | Converts number to text |
Statistical
| Name | Syntax, parameters | Description | Example |
|---|---|---|---|
| AVERAGE | AVERAGE(Number1;Number2; ... ) | Returns the average of its arguments | AVERAGE(3;5;1) ⇒ 3
Inputs linked to data X[0;1;2;3;4;5;6]): AVERAGE({X⇓3:⇓5}) ... AVERAGE(2; 3; 4) ⇒ 3 |
| AVERAGEIF | Returns the average (arithmetic mean) of all the values that meet a given criteria | ||
| AVERAGEIFS | Returns the average (arithmetic mean) of all the values that meet the given criterias | ||
| MAX | MAX(Number1;Number2; ... ) | Returns the maximum value in a list of arguments | MAX(3;5;1) ⇒ 5
Inputs linked to data X[0;1;2;3;4;5;6]): MAX({X⇓3:⇓5}) ... AVERAGE(2; 3; 4) ⇒ 3 |
| MIN | MIN(Number1;Number2; ... ) | Returns the minimum value in a list of arguments | MIN(3;5;1) ⇒ 1
Inputs linked to data X[0;1;2;3;4;5;6]): MIN({X⇓3:⇓5}) ... AVERAGE(2; 3; 4) ⇒ 2 |
| PERCENTIL | PERCENTILE(Array;k) | Returns the k-th percentile of values in a range | Inputs linked to data X[1;2;3;4;5]):
PERCENTILE({X⇕};0.5) ⇒ 3 |
| PERCENTILE.EXC | PERCENTILE.EXC(Array;k) | Returns the k-th percentile of values in a range, where k is in the range 0..1, exclusive | Inputs linked to data X[1;2;3;4;5]):
PERCENTILE.INC({X⇕};1) ⇒ NAN PERCENTILE.INC({X⇕};0.4) ⇒ 2.4 |
| PERCENTILE.INC | PERCENTILE.INC(Array;k) | Returns the k-th percentile of values in a range | Inputs linked to data X[1;2;3;4;5]):
PERCENTILE.INC({X⇕};1) ⇒ 5 |
| STDEV | STDEV(Number1;Number2; ... ) | Estimates standard deviation based on a sample | Inputs linked to data X[1;2;3;4;5]):
STDEV({X⇕}) ⇒ 1.581 |
| STDEV.P | STDEV.P(Number1;Number2; ... ) | Calculates standard deviation based on the entire population | Inputs linked to data X[1;2;3;4;5]):
STDEV.P({X⇕}) ⇒ 1.414 |
| STDEV.S | STDEV.S(Number1;Number2; ... ) | Estimates standard deviation based on a sample | Inputs linked to data X[1;2;3;4;5]):
STDEV.S({X⇕}) ⇒ 1.581 |
| TRIMMEAN | Returns the mean of the interior of a data set | ||
| MODE | MODE(Number1;Number2; ... ) | Returns the most common value in a data set | Inputs linked to data X[1;2;3;4;5]):
MODE(({X⇕}) ⇒ NAN MODE(({X⇕};3) ⇒ 3 |
| MEDIAN | MEDIAN(Number1;Number2; ... ) | Returns the median of the given numbers | MEDIAN(1;2;3;4;5;6;7) ⇒ 4 |
Lookup
| Name | Syntax, parameters | Description | Example | |
|---|---|---|---|---|
| INDEX | INDEX(Array;Index) | Uses an index to choose a value from a reference or array | Inputs linked to data Y[15;16;11;27;22]):
INDEX({Y⇓};2) ⇒ 16 INDEX({Y⇓};4) ⇒ 27 INDEX({Y⇓};9) ⇒ NAN |
|
| LINEARINTERPOLATION | LINEARINTERPOLATION(X;Coordinates X;Coordinates Y) | Calculates Y corresponding to X based upon linear interpolation of coordinates X, Y | ||
| MATCH | MATCH(Value;Array;[ Type = 1 ]) | Looks up values in a reference or array
- Type = 1 find max. value less or equal to Value ...values in Array must be sorted in ascending order - Type = -1 find min. value greater or equal to Value ...values in Array must be sorted in descending order - Type = 0 find first value equal to Value ...values in Array needn't to be sorted |
Inputs linked to data Y[15;16;11;27;22]):
MATCH(11;{Y⇕}) ⇒ 3 MATCH(27;{Y⇕}) ⇒ 4 MATCH(999;{Y⇕}) ⇒ NAN |
Matrix
| Name | Syntax, parameters | Description | Example | ||||||||||||||||||||||||||||||||||||||||||||||||||||
|---|---|---|---|---|---|---|---|---|---|---|---|---|---|---|---|---|---|---|---|---|---|---|---|---|---|---|---|---|---|---|---|---|---|---|---|---|---|---|---|---|---|---|---|---|---|---|---|---|---|---|---|---|---|---|---|
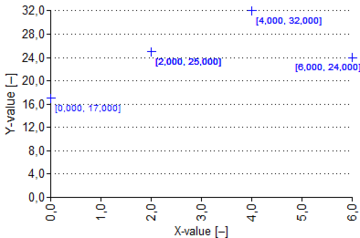
| FILTERTABLE | FILTERTABLE(Coordinates X;Coordinates Y) | Filters repeating values and keeps the last one of them
Returns matrix with 2 columns: Column 1: X - Filtered X Column 2: Y - Filtered Y |
Inputs linked to data
FILTERTABLE({X-value⇕};{Y-value⇕}) (
|
||||||||||||||||||||||||||||||||||||||||||||||||||||
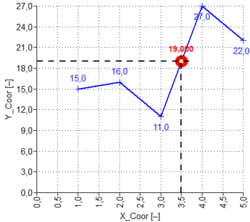
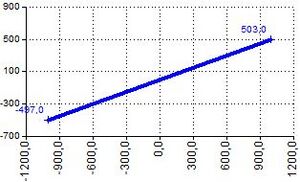
| LINEARTREND | LINEARTREND(Coordinates X;Coordinates Y) | Returns the linear trend line
Returns matrix with 1 row and 2 columns:
|
Inputs linked to data
X[1;2;3;4;5]; Y[15;16;11;27;22] LINEARTREND({X⇕};{Y⇕}) NumRows = 1
|
||||||||||||||||||||||||||||||||||||||||||||||||||||
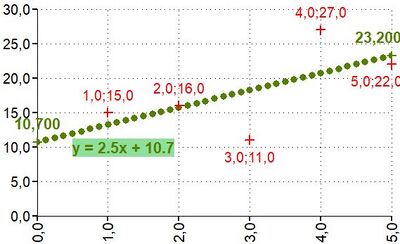
| LINEARTRENDANDPOINTS | LINEARTRENDANDPOINTS(Coordinates X;Coordinates Y) | Returns the linear trend line and its point representation
Returns matrix with 2 rows and 4 columns:
|
Inputs linked to data
X[1;2;3;4;5]; Y[15;16;11;27;22] LINEARTREND({X⇕};{Y⇕}) NumRows = 2;
| ||||||||||||||||||||||||||||||||||||||||||||||||||||
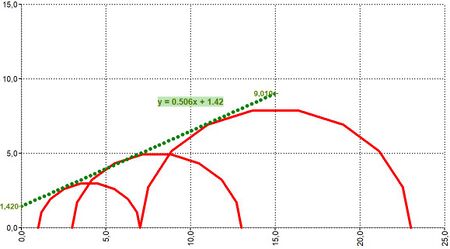
| LINEARTRENDSC | LINEARTRENDSC(Center X;Radius) | Returns the linear trend line for semi-circles
Returns matrix with 1 row and 2 columns:
|
Inputs linked to data
X[4;8;15]; R[3;5;8] LINEARTRENDSC({X⇕};{R⇕}) NumRows = 1
|
||||||||||||||||||||||||||||||||||||||||||||||||||||
| LINEARTRENDSCANDPOINTS | LINEARTRENDSCANDPOINTS(Center X;Radius) | Returns the linear trend line for semi-circles and its point representation
Returns matrix with 2 rows and 4 columns:
|
Inputs linked to data
X[4;8;15]; R[3;5;8] LINEARTRENDSCANDPOINTS({X⇕};{R⇕}) NumRows = 2
| ||||||||||||||||||||||||||||||||||||||||||||||||||||
| LINEARTRENDTOPOINTS | LINEARTRENDTOPOINTS(Slope;Offset) | Returns points of the linear trend line
Returns matrix with 2 rows and 2 columns:
|
LINEARTRENDTOPOINTS(0,5;3)
NumRows = 2
|
||||||||||||||||||||||||||||||||||||||||||||||||||||
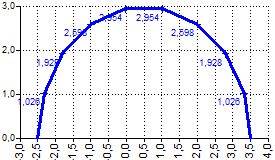
| SEMICIRCLETOPOINTS | SEMICIRCLETOPOINTS(Center X;Radius;[Points count 10]) | Returns points of the semi-circle
Returns matrix with 2 rows and [Points count] columns:
|
SEMICIRCLETOPOINTS(0,5;3;10)
NumRows = 10
|
||||||||||||||||||||||||||||||||||||||||||||||||||||
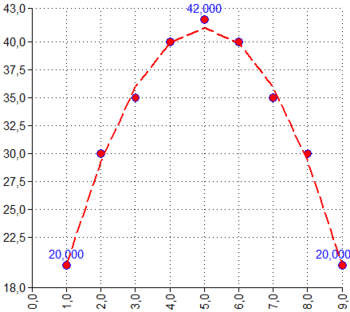
| POLYNOMIALTREND | POLYNOMIALTREND(Coordinates X;Coordinates Y;[Order=2];[Force origin=False]) | Returns the polynomial trend curve
Returns matrix with 1 columns: Column 1 coefficients: c - Coefficients c0 + c1*x + c2*x2 + ... |
POLYNOMIALTRENDANDPOINTS({X-Input⇕};{Y-Input⇕};2;9)
Order = 2 Points count = 9 Coeff.: c0 = 8,238; c1 = 13.203; c2 = -1.32 Approx. formula: y = -1,32x2 + 13,203x + 8,238 Results:
|
||||||||||||||||||||||||||||||||||||||||||||||||||||
| POLYNOMIALTRENDANDPOINTS | POLYNOMIALTRENDANDPOINTS(Coordinates X;Coordinates Y;[Order=2 ];[Points count=10];[Force origin=False]) | Returns the polynomial trend curve and its point representation
Returns matrix with 3 columns: Column 1 coefficients: c - Coefficients c0 + c1*x + c2*x2 + ... Column 2: X - Coordinates X Column 3: Y - Coordinates Y Force origin: True ... if you want include point (0,0) in Coordinates X and Y | |||||||||||||||||||||||||||||||||||||||||||||||||||||
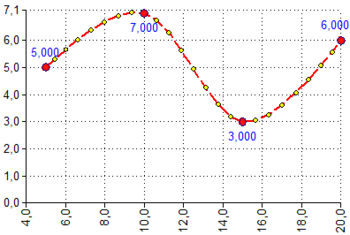
| SPLINE | SPLINE(Coordinates X;Coordinates Y;[Points count=20]) | Returns points of the spline running through given points
Returns matrix with 2 columns: Column 1: X - Coordinates X Column 2: Y - Coordinates Y Coordinates X and Y are part of the Spline curve Inputs:
|
SPLINE({X-Input⇕};{Y-Input⇕};[Num of Points])
Num of Points = 8 Results:
|
Informative
| Name | Syntax, parameters | Description | Example | |
|---|---|---|---|---|
| ISIMPERIAL | ISIMPERIAL() | Returns TRUE if project is calculated in imperial units | If the project is in imperial [ft, in, ...] units:
ISIMPERIAL() ⇒ TRUE; ⇒ 1 ISMETRIC() ⇒ FALSE; ⇒ 0 |
|
| ISMETRIC | ISMETRIC() | Returns TRUE if project is calculated in metric units | If the project is in metric [m, mm, ...] units:
ISMETRIC() ⇒ TRUE; ⇒ 1 ISIMPERIAL() ⇒ FALSE; ⇒ 0 |
|
| ISNUMBER | ISNUMBER() | Returns TRUE if argument is number | ISNUMBER(15) ⇒ TRUE; ⇒ 1
ISNUMBER(15e2) ⇒ TRUE; ⇒ 1 ISNUMBER(1/4) ⇒ TRUE; ⇒ 1 ISNUMBER(aaa) ⇒ FALSE; ⇒ 0 |
|
| ISTEXT | ISTEXT() | Returns TRUE if argument is text | ISTEXT(123)
ISTEXT("123") ISTEXT(abc) ISTEXT("abc") |
|
| LANG | LANG() | LANG([ Application = False ]) | If the application is in English and output language is Spanish:
LANG(FALSE()) ⇒ EN; LANG(0) ⇒ EN LANG(TRUE()) ⇒ ES; LANG(1) ⇒ ES |
Geotechnic
| Name | Syntax, parameters | Description | Example | |||||||||||||||||||||||||||||||||||||||||||||||||||||||||||||||
|---|---|---|---|---|---|---|---|---|---|---|---|---|---|---|---|---|---|---|---|---|---|---|---|---|---|---|---|---|---|---|---|---|---|---|---|---|---|---|---|---|---|---|---|---|---|---|---|---|---|---|---|---|---|---|---|---|---|---|---|---|---|---|---|---|---|---|
| FINESOILCLASSIFICATION | FINESOILCLASSIFICATION(Plasticity Index [-];Moisture [-];
Method 0 = EN ISO 14688-2 (2018); 1 = EN ISO 14688-2 (2013); 2 = ČSN 73 6133) For classification we can use these standards for plasticity diagram: |
Returns the classification of fine soil according to selected method
For inputs use number from interval (0;1) FINESOILCLASSIFICATION(0.137;0.333;0) ⇒ ClL or percetage FINESOILCLASSIFICATION(13.7/100;33.3/100;0) ⇒ ClL or inputs linked to data according to unit FINESOILCLASSIFICATION({I\_p\-⇓ [-]}/100;{LiqLimit⇓ [-]}/100;0) or inputs linked to data with unit setup FINESOILCLASSIFICATION({I\_p\-⇓ [-]};{LiqLimit⇓ [-]};0) |
FINESOILCLASSIFICATION(0.137;0.333;0) ⇒ ClLFINESOILCLASSIFICATION(0.137;0.333;1) ⇒ ClL | |||||||||||||||||||||||||||||||||||||||||||||||||||||||||||||||
| SOILCLASSIFICATION | SOILCLASSIFICATION(Size [mm];Fall [-];Method 0 = EN ISO 14688-2 (2018)) | Returns the classification of soil according to selected method |
|
Date and Time
| Name | Syntax, parameters | Description | Example |
|---|---|---|---|
| DATE | DATE(Year;Month;Day) | Returns the serial number of a particular date | DATE(1899;12;30) ⇒ 0
DATE(2024;10;31) ⇒ 45596 Inputs linked to data {MyYear}=2024;{MyMonth}=10;{MyDay}=31 DATE({MyYear};{MyMonth};{MyDay}) ⇒ 45596 |
| NOW | NOW() | Returns the serial number of the current date and time | For date and time 20.12.2024 13:48:04 is
NOW() ⇒ 45646.5750510648 For date and time 01.01.1900 00:00:00 is NOW() ⇒ 1.00 |
| TIME | TIME(Hour;Minute;Second) | Returns the serial number of a particular time | TIME(0;0;0) ⇒ 0
TIME(18;15;20) ⇒ 0.760648 Inputs linked to data {MyHour}=10[hour];{MyMinute}=15[min.];{MySecond}=25[sec.] TIME({MyHour};{MyMinute};{MySecond}) ⇒ 0.42737 |
| TODAY | TODAY() | Returns the serial number of the current date | For date 20:12:2024
TODAY() ⇒ 45646 For date 1.1.1900 TODAY() ⇒ 1 |
