Difference between revisions of "Formula Specification in Templates"
(→Matrix) |
(→Matrix) |
||
| Line 376: | Line 376: | ||
{| class="wikitable" | {| class="wikitable" | ||
|+ | |+ | ||
!Row | !''Row'' | ||
!Col. 1 | !''Col. 1'' | ||
!Col. 2 | !''Col. 2'' | ||
|- | |- | ||
|1 | |''1'' | ||
|2.5 | |''2.5'' | ||
|10.7 | |''10.7'' | ||
|} | |} | ||
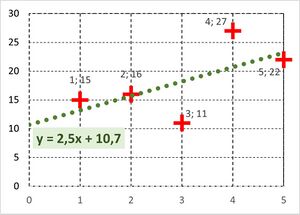
| rowspan="2" |[[File:LinearTrend.jpg|thumb|center|Results of linear trend]] | | rowspan="2" |[[File:LinearTrend.jpg|thumb|center|Results of linear trend]] | ||
| Line 419: | Line 419: | ||
|- | |- | ||
|+ | |+ | ||
!Row | !''Row'' | ||
!Col. 1 | !''Col. 1'' | ||
!Col. 2 | !''Col. 2'' | ||
!Col. 3 | !''Col. 3'' | ||
!Col. 4 | !''Col. 4'' | ||
|- | |- | ||
|1. | |''1.'' | ||
|''2.5'' | |''2.5'' | ||
|10.7 | |''10.7'' | ||
|0 | |''0'' | ||
|10.7 | |''10.7'' | ||
|- | |- | ||
|2. | |''2.'' | ||
|NAN | |''NAN'' | ||
|NAN | |''NAN'' | ||
|5 | |''5'' | ||
|23.2 | |''23.2'' | ||
|} | |} | ||
|- | |- | ||
| Line 458: | Line 458: | ||
''NumRows = 1'' | ''NumRows = 1'' | ||
{| class="wikitable" | {| class="wikitable" | ||
!Row | !''Row'' | ||
!Col. 1 | !''Col. 1'' | ||
!Col. 2 | !''Col. 2'' | ||
|- | |- | ||
|1 | |''1'' | ||
|0.506 | |''0.506'' | ||
|1.42 | |''1.42'' | ||
|} | |} | ||
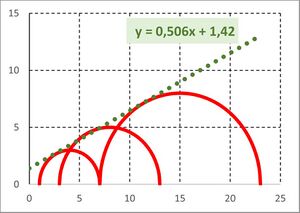
| rowspan="2" |[[File:LinTrendSC.jpg|center|thumb|Results of linear trend and points]] | | rowspan="2" |[[File:LinTrendSC.jpg|center|thumb|Results of linear trend and points]] | ||
| Line 498: | Line 498: | ||
''NumRows = 2'' | ''NumRows = 2'' | ||
{| class="wikitable" | {| class="wikitable" | ||
!Row | !''Row'' | ||
!Col. 1 | !''Col. 1'' | ||
!Col. 2 | !''Col. 2'' | ||
!Col. 3 | !''Col. 3'' | ||
!Col. 4 | !''Col. 4'' | ||
|- | |- | ||
|1. | |''1.'' | ||
|0.506 | |''0.506'' | ||
|1.42 | |''1.42'' | ||
|0 | |''0'' | ||
|1.42 | |''1.42'' | ||
|- | |- | ||
|2. | |''2.'' | ||
|NAN | |''NAN'' | ||
|NAN | |''NAN'' | ||
|15 | |''15'' | ||
|9.01 | |''9.01'' | ||
|} | |} | ||
|- | |- | ||
| Line 537: | Line 537: | ||
''NumRows = 2'' | ''NumRows = 2'' | ||
{| class="wikitable" | {| class="wikitable" | ||
!Row | !''Row'' | ||
!Col. 1 | !''Col. 1'' | ||
!Col. 2 | !''Col. 2'' | ||
|- | |- | ||
|1. | |''1.'' | ||
| -1000 | | ''-1000'' | ||
| -497 | | ''-497'' | ||
|- | |- | ||
|2. | |''2.'' | ||
|1000 | |''1000'' | ||
|503 | |''503'' | ||
|} | |} | ||
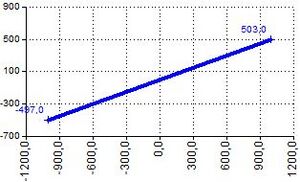
|[[File:LintrendToPoints.jpg|center|thumb|Results of linear trend]] | |[[File:LintrendToPoints.jpg|center|thumb|Results of linear trend]] | ||
| Line 583: | Line 583: | ||
''NumRows = 10'' | ''NumRows = 10'' | ||
{| class="wikitable" | {| class="wikitable" | ||
!Row | !''Row'' | ||
!X | !''X'' | ||
!Y | !''Y'' | ||
|- | |- | ||
|1. | |''1.'' | ||
| -2,5 | | ''-2,5'' | ||
|0 | |''0'' | ||
|- | |- | ||
|2. | |''2.'' | ||
| -2,31908 | | ''-2,31908'' | ||
|1,02606 | |''1,02606'' | ||
|- | |- | ||
|3. | |''3.'' | ||
| -1,79813 | | ''-1,79813'' | ||
|1,928363 | |''1,928363'' | ||
|- | |- | ||
|4. | |''4.'' | ||
| -1 | | ''-1'' | ||
|2,598076 | |''2,598076'' | ||
|- | |- | ||
|5. | |''5.'' | ||
| -0,02094 | | ''-0,02094'' | ||
|2,954423 | |''2,954423'' | ||
|- | |- | ||
|6. | |''6.'' | ||
|1,020945 | |''1,020945'' | ||
|2,954423 | |''2,954423'' | ||
|- | |- | ||
|7. | |''7.'' | ||
|2 | |''2'' | ||
|2,598076 | |''2,598076'' | ||
|- | |- | ||
|8. | |''8.'' | ||
|2,798133 | |''2,798133'' | ||
|1,928363 | |''1,928363'' | ||
|- | |- | ||
|9. | |''9.'' | ||
|3,319078 | |''3,319078'' | ||
|1,02606 | |''1,02606'' | ||
|- | |- | ||
|10. | |''10.'' | ||
|3,5 | |''3,5'' | ||
|3,67E-16 | |''3,67E-16'' | ||
|} | |} | ||
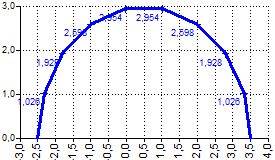
|[[File:SemicircleToPoints.jpg|center|thumb|Results of semi-circle to points]] | |[[File:SemicircleToPoints.jpg|center|thumb|Results of semi-circle to points]] | ||
|} | |} | ||
Revision as of 14:50, 8 June 2023
List of formula specification using in Templates. (Notes: bold inputs for functions are linked to the data in program).
Categories of functions:
Logical
| Name | Syntax, parameters | Description | Example |
|---|---|---|---|
| AND | AND(Boolean1;Boolean2; ... ) | Returns TRUE if all of its arguments are TRUE | AND(3=3;2=2) ⇒ TRUE |
| OR | OR(Boolean1;Boolean2; ... ) | Returns TRUE if any of its arguments are TRUE | OR(3=4;2=3) ⇒ FALSE |
| TRUE | TRUE() | Returns the logical value TRUE | IF(TRUE();1;2) ⇒ 1 |
| FALSE | FALSE() | Returns the logical value FALSE | IF(FALSE();1;2) ⇒ 2 |
| IF | IF(Test;Then;Else) | Specifies a logical test to perform
- inputs can be linked to data - result can be number, text, logical value |
Result is number (bold inputs linked to data X[0;1;2;3;4;5;6]):
IF(220>200;220-200;200-220) ⇒ 20 IF(120>MAX([X⇕]);120;-1) ⇒ 120 IF(MAX([X⇓2:⇓3])>[X⇓7];MAX([X⇓2:⇓3]);[X⇓7])) ⇒ 6 IF(MAX(⟨1;2⟩)>6;MAX(⟨1;2⟩);6) ⇒ 6 Result is text: Input [Coordinate Z] = 210;[GWT] = 180 IF([Coordinate Z]>0;"Above terrain";"Under terrain") ⇒ "Top above terrain" IF([GWT]<[Coordinate Z];"GWT under top of the test.";"Measure error.") ⇒ "GWT under top of the test." |
| IFS | IFS(Test1;Then1;Test2;Then2; ... ;Else) | Checks whether one or more conditions are met and returns a value that corresponds to the first TRUE condition | Input [GWT] = 15
IFS([GWT]>8;10;[GWT]>6;9;[GWT]>3;8;-1) ⇒ 10 |
| NOT | NOT(Boolean) | Reverses the logic of its argument | IF(NOT(5>6);175;155) ⇒ 175
IF(NOT(5>4);175;155) ⇒ 155 IF(NOT("A"="B");175;155)⇒ 175 |
| SWITCH | SWITCH(Switch;Case1;Result1;Case2;Result2; ... ;[ Else ]) | Evaluates an expression against a list of values and returns the result corresponding to the first matching value. If there is no match, an optional default value may be returned | SWITCH(50>6;TRUE();44;FALSE();56;-111) ⇒ 44
SWITCH(30/6;3;120;4;220;5;320;420) ⇒ 320 |
Mathematical
| Name | Syntax, parameters | Description | Example |
|---|---|---|---|
| ABS | ABS(Number) | Returns the absolute value of a number | ABS(120) ⇒ 120; ABS(-120) ⇒ 120 |
| ACOS | ACOS(Number) | Returns the arccosine of a number ⟨-Pi/2; Pi/2⟩ | for X=0.5 ... DEGREES(ACOS(0.5)) ⇒ 60° |
| ACOT | ACOT(Number) | Returns the arccotangent of a number ⟨0; Pi⟩ | for X=1 ... DEGREES(ACOT(1)) ⇒ 45° |
| ASIN | ASIN(Number) | Returns the arcsine of a number ⟨-Pi/2; Pi/2⟩ | for X=0.5 ... DEGREES(ASIN(0.5)) ⇒ 30° |
| ATAN | ATAN(Number) | Returns the arctangent of a number ⟨-Pi/2; Pi/2⟩ | for X=1 ... DEGREES(ATAN(1)) ⇒ 45° |
| COS | COS(Angle[rad]) | Returns the cosine of the given angle in rad | for α=60° ... COS(RADIANS(60)) ⇒ 0.5 |
| SIN | SIN(Angle[rad]) | Returns the sine of the given angle in rad | for α=30° ... SIN(RADIANS(30)) ⇒ 0.5 |
| COT | COT(Angle[rad]) | Returns the cotangent of an angle in rad | for α=45° ... COT(RADIANS(45)) ⇒ 1 |
| TAN | TAN(Angle[rad]) | Returns the tangent of an angle in rad | for α=45° ... TAN(RADIANS(45)) ⇒ 1 |
| EXP | EXP(Number) | Returns e raised to the power of a given number | EXP(1) ⇒ 2.71828 |
| LN | LN(Number) | Returns the natural logarithm of a number | LN(1)) ⇒ 0; LN(EXP(1)) ⇒ 1 |
| LOG | LOG(Number;[Base=10]) | Returns the logarithm of a number to a specified base (10 if missing) | LOG(1; 10) ⇒ 0; LOG(10; 10) ⇒ 1 |
| LOG10 | LOG10(Number) | Returns the base-10 logarithm of a number | LOG10(1) ⇒ 0; LOG10(10) ⇒ 1 |
| PI | PI() | Returns the value of pi | PI() ⇒ 3.141592653 |
| POWER | POWER(Base;Number) | Returns the result of a number raised to a power | POWER(2;4) ⇒ 16 |
| SQR | SQR(Number) | Returns the result of a squared number | SQR(5) ⇒ 25; SQR(-5) ⇒ 25 |
| SQRT | SQRT(Number) | Returns a positive square root of a positive Number | SQRT(36) ⇒ 6; SQRT(-36) ⇒ NAN |
| SUM | SUM(Number1;Number2; ... ) | Returns the sum of a series of numbers | Inputs linked to data X[0;1;2;3;4;5;6]):
SUM([X⇓2:⇓5]) ... SUM(⟨1; 2; 3; 4⟩) ⇒ 10 SUM([X⇕]) ⇒ 21 |
| DEG | DEGREES(Angle [rad]) | Converts radians into degrees | DEGREES(PI()) ⇒ 180°; DEGREES(PI()/2) ⇒ 90° |
| RAD | RADIANS(Number) | Converts degrees to radians | RADIANS(180) ⇒ π (3.141592653) |
| ROUND | ROUND(Number;Places) | Rounds a number to a specified number of digits
- negative Places round to the left of the decimal point |
ROUND(58.563;3) ⇒ 58.563
ROUND(58.563;2) ⇒ 58.56 ROUND(58.563;1) ⇒ 58.6 ROUND(58.563;0) ⇒ 59 ROUND(58.563;-1) ⇒ 60 ROUND(58.563;-2) ⇒ 100 |
| ROUNDUP | ROUNDUP(Number;Places) | Rounds a number up, toward zero | ROUNDUP(58.563;3) ⇒ 58.564
ROUNDUP(58.563;2) ⇒ 58.57 ROUNDUP(58.563;1) ⇒ 58.6 ROUNDUP(58.563;0) ⇒ 59 |
| ROUNDDOWN | ROUNDDOWN(Number;Places) | Rounds a number down, toward zero | ROUNDDOWN(58.563;3) ⇒ 58.563
ROUNDDOWN(58.563;2) ⇒ 58.56 ROUNDDOWN(58.563;1) ⇒ 58.5 ROUNDDOWN(58.563;0) ⇒ 58 ROUNDDOWN(58.563;-1) ⇒ 50 ROUNDDOWN(58.563;-2) ⇒ 0 |
Text
| Name | Syntax, parameters | Description | Example |
|---|---|---|---|
| CONCAT | CONCAT(Value1;Value2; ... ) | Combines the text from multiple ranges and/or strings, but it doesn't provide the delimiter or IgnoreEmpty arguments
- Value1, Value2, ... can be as Text or Number |
CONCAT(12;34;56) ⇒ 123456.000
CONCAT("12";"34";"56") ⇒ 123456.000 CONCAT(12;"34";56) ⇒ 123456.000 Input [GWTb] = 15 CONCAT([GWTb];" m") ⇒ "15 m" |
| LEFT | LEFT(Text;[Count=1]) | Returns the leftmost characters from a text value | LEFT("qwert";3) ⇒ "qwe"
LEFT("qwert";1) ⇒ "q" |
| RIGHT | RIGHT(Text;[Count=1]) | Returns the rightmost characters from a text value | RIGHT("qwert";3) ⇒ "ert"
RIGHT("qwert";1) ⇒ "t" |
| LEN | LEN(Text) | Returns the number of characters in a text string | LEN("qwert") ⇒ 5
LEN("") ⇒ 0 |
| SEARCH | SEARCH(Find text;Within text;[Start=1]) | Finds one text value within another (not case-sensitive) | SEARCH("G";"Hello GEO!";1) ⇒ 7 |
Statistical
| Name | Syntax, parameters | Description | Example |
|---|---|---|---|
| AVERAGE | AVERAGE(Number1;Number2; ... ) | Returns the average of its arguments | AVERAGE(3;5;1) ⇒ 3
Inputs linked to data X[0;1;2;3;4;5;6]): AVERAGE([X⇓3:⇓5]) ... AVERAGE(⟨2; 3; 4⟩) ⇒ 3 |
| MAX | MAX(Number1;Number2; ... ) | Returns the maximum value in a list of arguments | MAX(3;5;1) ⇒ 5
Inputs linked to data X[0;1;2;3;4;5;6]): MAX([X⇓3:⇓5]) ... AVERAGE(⟨2; 3; 4⟩) ⇒ 3 |
| MIN | MIN(Number1;Number2; ... ) | Returns the minimum value in a list of arguments | MIN(3;5;1) ⇒ 1
Inputs linked to data X[0;1;2;3;4;5;6]): MIN([X⇓3:⇓5]) ... AVERAGE(⟨2; 3; 4⟩) ⇒ 2 |
| PERCENTIL | PERCENTILE(Array;k) | Returns the k-th percentile of values in a range | Inputs linked to data X[1;2;3;4;5]):
PERCENTILE([X⇕];0.5) ⇒ 3 |
| PERCENTILE.EXC | PERCENTILE.EXC(Array;k) | Returns the k-th percentile of values in a range, where k is in the range 0..1, exclusive | Inputs linked to data X[1;2;3;4;5]):
PERCENTILE.INC([X⇕];1) ⇒ NAN PERCENTILE.INC([X⇕];0.4) ⇒ 2.4 |
| PERCENTILE.INC | PERCENTILE.INC(Array;k) | Returns the k-th percentile of values in a range | Inputs linked to data X[1;2;3;4;5]):
PERCENTILE.INC([X⇕];1) ⇒ 5 |
| STDEV | STDEV(Number1;Number2; ... ) | Estimates standard deviation based on a sample | Inputs linked to data X[1;2;3;4;5]):
STDEV([X⇕]) ⇒ 1.581 |
| STDEV.P | STDEV.P(Number1;Number2; ... ) | Calculates standard deviation based on the entire population | Inputs linked to data X[1;2;3;4;5]):
STDEV.P([X⇕]) ⇒ 1.414 |
| STDEV.S | STDEV.S(Number1;Number2; ... ) | Estimates standard deviation based on a sample | Inputs linked to data X[1;2;3;4;5]):
STDEV.S([X⇕]) ⇒ 1.581 |
| MODE | MODE(Number1;Number2; ... ) | Returns the most common value in a data set | Inputs linked to data X[1;2;3;4;5]):
MODE(([X⇕]) ⇒ NAN MODE(([X⇕];3) ⇒ 3 |
| MEDIAN | MEDIAN(Number1;Number2; ... ) | Returns the median of the given numbers | MEDIAN(1;2;3;4;5;6;7) ⇒ 4 |
Matrix
| Name | Syntax, parameters | Description | Example | ||||||||||||||||||||||||||||||||||||||||||||||||||||
|---|---|---|---|---|---|---|---|---|---|---|---|---|---|---|---|---|---|---|---|---|---|---|---|---|---|---|---|---|---|---|---|---|---|---|---|---|---|---|---|---|---|---|---|---|---|---|---|---|---|---|---|---|---|---|---|
| LINEARTREND | LINEARTREND(Coordinates X;Coordinates Y) | Returns the linear trend line
Returns matrix with 1 row and 2 columns:
|
Inputs linked to data
X[1;2;3;4;5]; Y[15;16;11;27;22] LINEARTREND([X⇕];[Y⇕]) NumRows = 1
|
||||||||||||||||||||||||||||||||||||||||||||||||||||
| LINEARTRENDANDPOINTS | LINEARTRENDANDPOINTS(Coordinates X;Coordinates Y) | Returns the linear trend line and its point representation
Returns matrix with 2 rows and 4 columns:
|
Inputs linked to data
X[1;2;3;4;5]; Y[15;16;11;27;22] LINEARTREND([X⇕];[Y⇕]) NumRows = 2;
| ||||||||||||||||||||||||||||||||||||||||||||||||||||
| LINEARTRENDSC | LINEARTRENDSC(Center X;Radius) | Returns the linear trend line for semi-circles
Returns matrix with 1 row and 2 columns:
|
Inputs linked to data
X[4;8;15]; R[3;5;8] LINEARTRENDSC([X⇕];[R⇕]) NumRows = 1
|
||||||||||||||||||||||||||||||||||||||||||||||||||||
| LINEARTRENDSCANDPOINTS | LINEARTRENDSCANDPOINTS(Center X;Radius) | Returns the linear trend line for semi-circles and its point representation
Returns matrix with 2 rows and 4 columns:
|
Inputs linked to data
X[4;8;15]; R[3;5;8] LINEARTRENDSCANDPOINTS([X⇕];[R⇕]) NumRows = 2
| ||||||||||||||||||||||||||||||||||||||||||||||||||||
| LINEARTRENDTOPOINTS | LINEARTRENDTOPOINTS(Slope;Offset) | Returns points of the linear trend line
Returns matrix with 2 rows and 2 columns:
|
LINEARTRENDTOPOINTS(0,5;3)
NumRows = 2
|
||||||||||||||||||||||||||||||||||||||||||||||||||||
| SEMICIRCLETOPOINTS | SEMICIRCLETOPOINTS(Center X;Radius;[Points count 10]) | Returns points of the semi-circle
Returns matrix with 2 rows and [Points count] columns:
|
SEMICIRCLETOPOINTS(0,5;3;10)
NumRows = 10
|


